Expert HVAC Engineering for Every Need

Design, installation, optimization, and maintenance tailored for diverse industries.

Comprehensive system design and planning services.

Expert installation and supervision for all projects.

Performance analysis to optimize HVAC efficiency.

An individual is in front of a computer monitor displaying a detailed architectural or engineering design, possibly a floor plan or structural layout with measurements and annotations. The design is composed of various lines in colors like yellow, red, and green against a dark background, and the interface resembles a CAD software.
A laboratory setup featuring various networking and testing equipment on a table. A computer monitor displaying test results with a 'Pass' message is prominently positioned. Multiple cables in orange and blue are connected to devices labeled 'Optical Phase Modulation Meter' and 'Test Station'. The environment appears clean and organized, suggesting a professional or industrial setting.
A smartphone mounted on a stand displays a screen showing performance metrics including CPU temperature, GPU temperature, memory usage, and cooler information. The interface design uses a futuristic style with red and blue accents.

Expert HVAC Solutions for All Needs

Oman HVAC Engineering specializes in system design, installation, and maintenance for diverse industries, ensuring optimal performance and compliance with safety standards for commercial, industrial, and healthcare applications.

A laptop with an open screen displaying dashboard analytics featuring charts, graphs, and numerical data related to sales and subscriptions. The interface is predominantly dark-themed with sections highlighting key performance metrics. The device shown is a MacBook Pro, indicated by the keyboard layout and branding.

150+

15

Trusted by Clients

Proven Expertise

Comprehensive HVAC Solutions

Expert design, installation, and maintenance for optimal performance in various industries and applications.

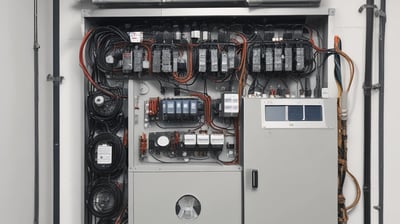
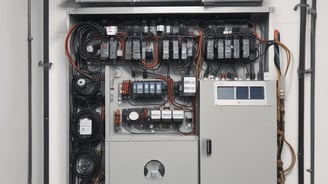
System Design Planning

Tailored HVAC system design for commercial, residential, and industrial applications ensuring efficiency and compliance.

A digital screen displaying analytical data with line graphs, histograms, and numerical values. The data is presented in a user-friendly interface with different shades of blue used to distinguish various elements.
Performance Analysis

In-depth performance analysis and optimization services to enhance system efficiency and reduce operational costs.

A computer monitor displays a software interface with multiple rectangular panels, each containing text and numerical data. The panels are organized in a grid format, aligned neatly across the screen. There are various icons and menus on the left and right sides of the screen indicating navigation options. The room reflects low ambient lighting, and the keyboard is visible in the foreground.

Our Projects

Explore our diverse projects in HVAC engineering and optimization.

A visualization of a data storage system featuring a main server unit connected to a series of cylindrical storage units. The server has multiple horizontal rows, each with indicators. The background is black, providing a strong contrast to the metallic and green tones of the server and storage units.
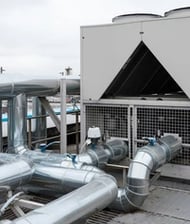
Commercial Installations

Expert HVAC solutions for offices and retail spaces.

A computer monitor displaying a design mock-up for a mobile payment application. The screen shows six design variations with different color schemes and layouts. A desk setup is visible in the background, including a keyboard, mouse, graphics tablet, and some plants.
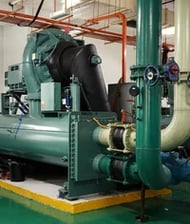
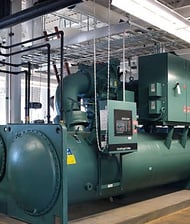
Industrial Solutions

Tailored HVAC systems for factories and warehouses.

A whiteboard or wall is filled with paper sheets and sticky notes containing diagrams, sketches, and notes. Prominent features include hand-drawn flowcharts with symbols and arrows, as well as several colored sticky notes with handwritten words like 'Feedback' and 'Infos + Features'. The central sheet displays a layout with text and colored dots, possibly representing an interface design or process.
A digital chart display featuring a green line graph against a dark background, with data units labeled in white text. The line graph suggests an analysis of data volume, with sharp peaks and valleys. The lower portion of the graph is highlighted in red, indicating critical data points or alerts.
Healthcare Facilities

Specialized climate control for hospitals and labs.
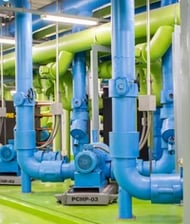
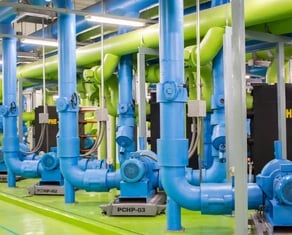
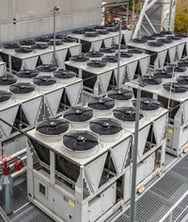
Data Centers

Precision HVAC for optimal server room performance.

Customer Reviews

Hear from our satisfied clients about their experiences with us.

Oman HVAC Engineering provided exceptional service and expertise in system optimization.

John Doe
A computer screen displaying a data analytics dashboard with graphs and charts. A blue line graph shows fluctuations in data over time, and a section highlights the number of page views. A pie chart is partially visible, indicating a breakdown of different data elements.

Muscat City

The team at Oman HVAC Engineering ensured our facility met all compliance standards efficiently and effectively. Their maintenance services are top-notch and highly reliable.

A computer screen displaying analytics dashboards with various charts, including a line graph on the left and a cohort analysis table on the right. The table is populated with different shades of blue, indicating varying levels of user activity over several weeks. Text labels and numbers detail user retention statistics.
Jane Smith

Salalah City

★★★★★
★★★★★